More solutions
One dashboard for your entire property, or all your properties. See live temperatures, energy savings in euros, open window alerts and device health at a glance.
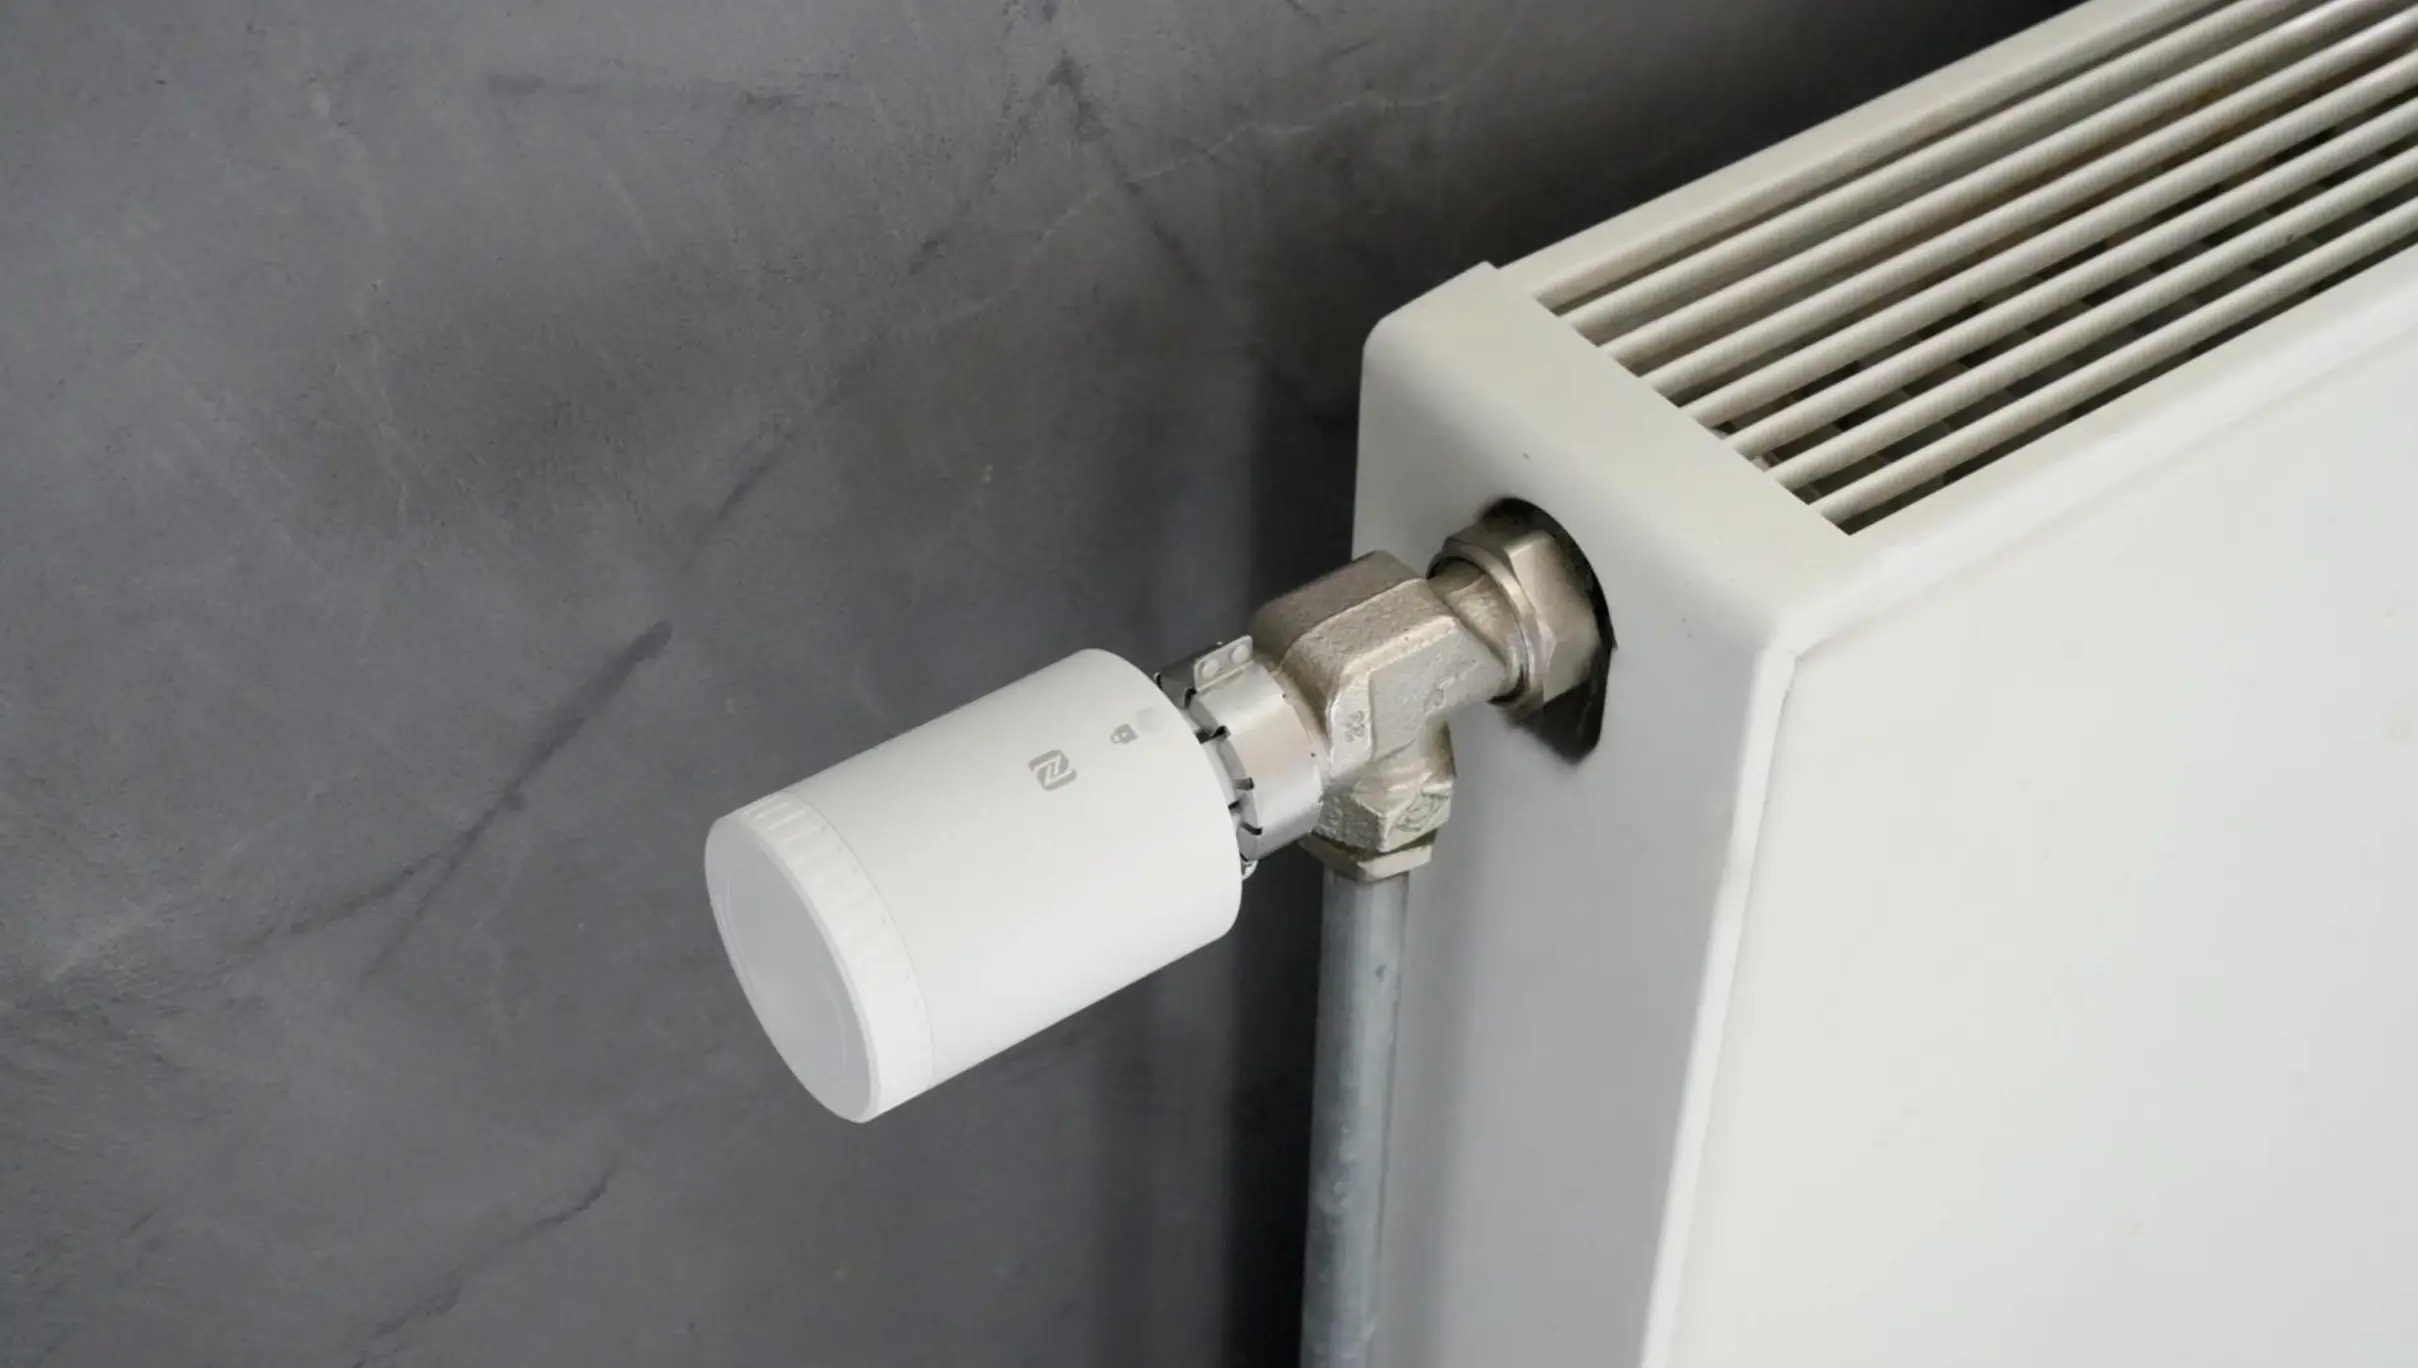
Live temperature and mode status for every room: occupied, pre-heating, standby, or alert. Colour-coded and instant.
See exactly how much Holio is saving you, daily, weekly or monthly. Also shown in m³ gas and kWh for sustainability reporting.
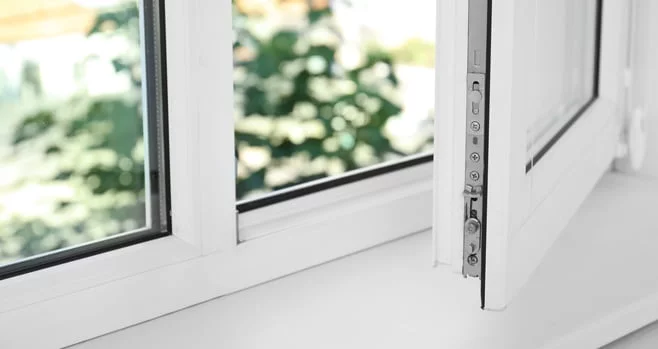
All open window alerts, rain events, and sensor issues in one feed, with timestamps, room numbers and resolution status.
Switch between properties in one click. Compare energy performance across your portfolio from a single login.
Download monthly and annual energy reports as PDF or CSV, ready for your accountant, ESG reporting or board presentation.
Battery levels, connectivity status and last-seen timestamps for every sensor. Low battery warnings arrive before devices go offline.
Your finance team wants numbers. Your general manager wants the headline. Your sustainability lead wants CO₂ figures. Holio's reports give everyone what they need. One click, no spreadsheets.
Every window event, rain alert, and sensor issue is captured instantly and pushed to your front office team and stored in the dashboard log for audit purposes. Staff always know what happened and when.
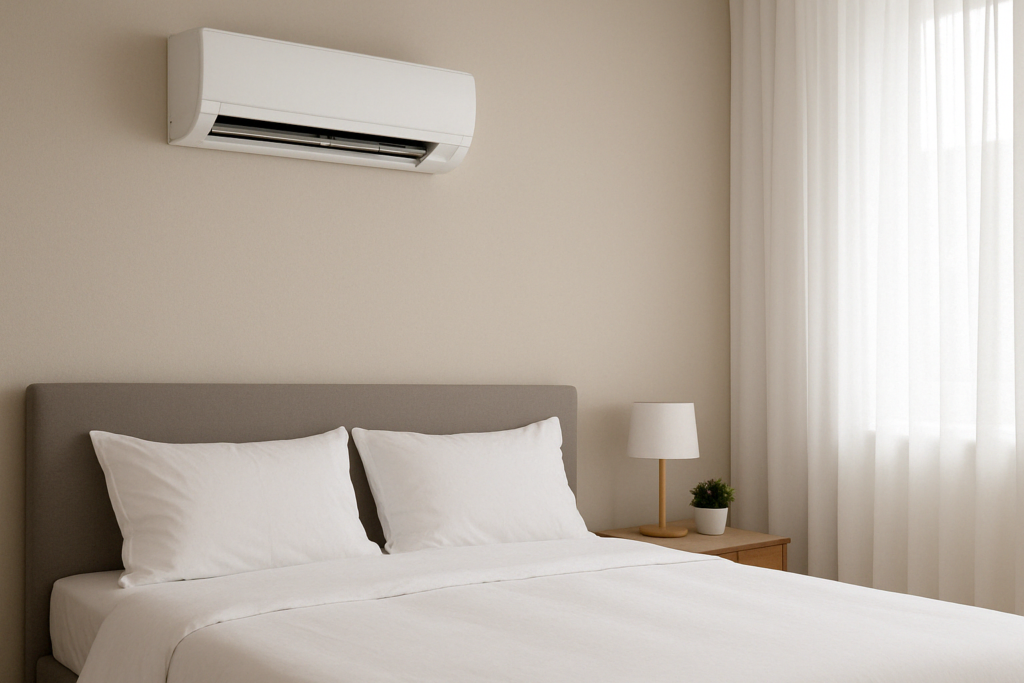
"We have split unit aircos in every room and had no way to manage them centrally. With Holio, every unit switches off automatically when a room is empty."
Book a 30-minute demo and we'll show you the dashboard live with real property data.